Balancing Inflation and Jobs: Revisiting the Phillips Curve

Dr. Nirmal Singh
Dr. Nirmal Singh is an assistant professor of economics, currently serving at Ramaiah University of Applied Sciences. He completed his PhD in Economics at IIT Roorkee, where he developed a solid foundation in research and academic rigor, contributing to publications that reflect his expertise in economics. Prior to his doctoral studies, he earned a Master’s degree in Economics from the Central University of Himachal Pradesh and a Bachelor of Commerce from Himachal Pradesh University.
With a strong academic background and experience in teaching, Dr. Singh is dedicated to advancing the understanding of economic theory and its applications. His research spans various areas of economics, and he has a keen interest in fostering analytical skills and critical thinking among his students. His area of research include Banking market structure, Bank stability, Income diversification, and institutional.
The Phillips curve is regarded as a very crucial tool for framing macroeconomic policies. It reflects the relationship between inflation and unemployment. To put it simply, it states that a compromise on the inflation front can bring down the unemployment numbers. Alternatively, letting unemployment spike can assist in bringing inflation down. This concept was introduced by A.W. Phillips in the 1950s. Post that, this relationship has been retested numerous times in the economic literature.
Recent studies have cast some skepticism over this relationship. Moreover, Jerome Powell (Federal Reserve chair) also acknowledged that the Phillips curve has become less reliable in recent years in his recent speech at the Jackson Hole Economic Symposium 2024.
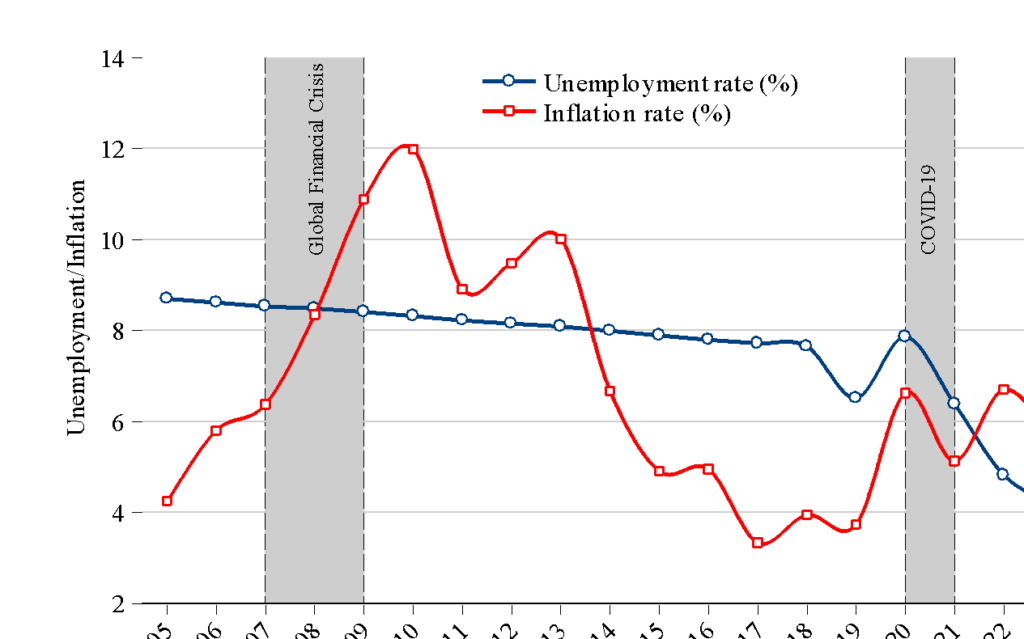
In this article, we revisit this relationship for India over the last 19 years (2005–2023). Our investigation showed that India has experienced a positive relationship between inflation and unemployment, contrary to what the Phillips curve suggests. This phenomenon is evident from the graphical representation.

The regression results reported in the table reveal a positive and statistically significant relationship between inflation and unemployment. This finding is consistent across different models. The coefficient of inflation is 0.142 in both models, suggesting that a one percentage increase in the inflation rate (CPI) will lead to, on average, a 14-percentage increase in the unemployment rate. Now, what could explain this unconventional relationship?
| Model | Robust SE | Newey-West SE |
|---|---|---|
| Constant | 6.641*** | 6.641*** |
| (0.629) | (0.738) | |
| Inflation | 0.142** | 0.142** |
| (0.06) | (0.065) | |
| F-Statistics | 5.70** | 4.83** |
| Obs. | 19 | 19 |
The basis for the conventional negative relationship between inflation and unemployment is that as the aggregate demand in the economy upsurges, it imposes an upward pressure on the general price level in the economy. This is also known as demand-pull inflation. To match this rise in demand, the producers increase the output, resulting in more jobs.
The likely cause of the positive relationship might be some of the significant events that the Indian economy experienced, i.e., Demonetisation, the introduction of GST, and COVID-19, which created temporary supply-side bottlenecks in the economy. All these events resulted in cost-push inflation, which might have resulted in higher production costs, leading to downsizing. This could be one of the reasons for the observed positive relationship between inflation and unemployment.
Hence, regulators and policymakers must comprehend the nature of inflation in order to frame macroeconomic policies. If the economy is experiencing inflationary pressure that predominates due to cost-push factors, then relying on the conventional Phillips curve might misguide macroeconomic policies.
Disclaimer
The content published on this blog is for informational purposes only. The opinions expressed here are solely those of the respective authors and do not necessarily reflect the views of Fintrac Advisors. We make no warranties about the completeness, reliability, and accuracy of this information. Any action you take based on the information presented on this blog is strictly at your own risk, and we will not be liable for any losses and damages in connection with the use of our blog. We recommend seeking professional expertise for any such work. External links on our blog may lead to sites that are not under our control, and we are not responsible for the nature, content, and availability of those sites.


